PowerClerk Support Center

Program Design
Automations
Questions to ask yourself
Locating the Automations feature
Creating an Automation
FAQs
Communication Templates
Questions to ask yourself
Locating the Communications feature
Creating Communication templates
Smart Templates
Feature reference
FAQs
Deadlines
Questions to ask yourself
Locating the Deadlines feature
How to create Deadlines
Delaying Deadlines
Deadline Automations
Deadlines in the Admin View
Deadlines in Communication Templates
Deadlines in Reports
Deadlines in Project List Columns
Deadline Functionality Definitions
Feature reference
FAQs
Forms
Questions to ask yourself
Locating the Forms feature
How to create and edit Forms
Adding data fields
Configuring Forms
VersaForms
Sensitive Data Fields
Feature reference
FAQs
Roles
Questions to ask yourself
Locating the Roles feature
How to create and edit a Role
Access Groups
Feature reference
FAQs
Workflow
Questions to ask yourself
Locating the Workflow feature
How to create and edit the Workflow
Transitions
Changing a project's status
Feature reference
FAQs
Advanced Program Design
Channels
Locating the Channels feature
What are Channels?
Channels Checklist
3-Step Publishing Process
Channel Type A: Mark As Child
Channel Type B: Make Successor
Channel Type C and D: Create/Submit Related Project
Sending Signals
Connections
Questions to ask yourself
Locating the Connections feature
What are Connections
Input and Output Fields
Connecting, Testing, and Enabling
Maintenance and Alterations
Connections Message Format
FAQ
Content Library
Questions to ask yourself
Locating the Content Library feature
Uploading content to the Content Library
Use with Communication Templates
Use for Front Page content
FAQs
Curated Lists
Built-in DER lists
Global Lists
FAQ
Document Templates
Questions to ask yourself
Locating the Document Templates feature
How to define a new Template
How to define a new Merged Document
eSignatures
DocuSign template tags
Mapping eSignature tags
Smart Templates
FAQs
Formulas and Calculated Fields
Questions to ask yourself
Locating the Formulas feature
How to create a Formula
Formula Data Dictionary
FAQs
Front Page
Questions to ask yourself
Locating the Front Page feature
How to edit the Front Page
FAQs
Incentive Design
Questions to ask yourself
Locating the Incentive Design feature
How to design an Incentive
Incentive Options
FAQs
Single Sign On (SSO)
Azure AD
Okta IDP Configuration
SP Configuration
SSO for multiple programs
PowerClerk API
Custom API IDs
FAQ
API Documentation for Developers
Application & Process Automation
Getting Started
Common Usage Scenarios
Using Custom IDs
API Method Reference
Code Samples
Administration
Business Days
Questions to ask yourself
Locating the Business Days feature
Setting up Business Days
FAQs
Dashboards
Questions to ask yourself
Locating the Dashboards feature
How to create widgets in your Dashboard
Other Dashboard Actions
Data Import
Questions to ask yourself
Locating the Data Import feature
How to validate a Data Import
FAQs
Duplicate Check
Questions to ask yourself
Locating the Duplicate Check feature
How to use Duplicate Checks
FAQs
ePayments
Questions to ask yourself
Locating the ePayments History feature
How to add ePayments
FAQ
Import Projects
Questions to ask yourself
Locating the Import Projects feature
How to Import From V2
FAQs
Operation Status
Questions to ask yourself
Locating the Operation Status feature
How to use the Operation Status feature
FAQs
Program Info
Project Inquiry
Questions to ask yourself
Locating the Program Info feature
How to edit the Program Info menu
Notification Banners
Usage Info
FAQs
Program Statistics
Questions to ask yourself
Locating the Program Statistics feature
How to use Program Statistics
FAQs
Reports
Questions to ask yourself
Locating the Reports feature
How to setup Reports
Multi-instance reports
Sharing Reports
Integrate scheduled Reports
Cross-Program Reports
FAQs
Test Environment
Questions to ask yourself
Locating the Test Environment feature
How to setup a Test Environment
FAQs
User Administration
Questions to ask yourself
Locating the User Administration feature
How to work with User Administration
FAQs
Integration Guides
Integration Guide 001: How to configure a Web Adapter – ArcGIS Implementation
Integration Guide 002: How to configure Electric Power Research Institute’s (EPRI) DRIVE Connect software with PowerClerk
Program Reporting
Data Fields
Questions to ask yourself
Locating the Data Fields feature
How to work with Data Fields
Custom Lists and Data Field Groups
Table form element
PV System + batteries element
FAQs
Milestones
Questions to ask yourself
Locating the Milestones feature
How to define a Milestone
FAQs
Project List Columns
Questions to ask yourself
Locating the Project List Columns feature
How to use Project List Columns
FAQs
Project Summary
Questions to ask yourself
Locating the Project Summary feature
FAQs
How to edit the Project Summary
Project Views
Questions to ask yourself
Locating the Project Views feature
How to edit Project Views
FAQs
PowerClerk Video Guides
New User Video Guide
Setting up Business Days
Dashboards
Edit Forms - Tutorial #1
Edit Forms - Tutorial #2
Configuring Forms
FormSense
Build A Formula
Automation with Formulas in Action Rules
Formulas and Advanced Visibility Rules
Calculated Fields
Milestones
Roles and User Administration
Visualize Workflows
Settings
My Account
Questions to ask yourself
Locating the My Account feature
How to use the My Account feature
Setting up Multi-Factor Authentication
MFA Recovery Guidelines
FAQs
FormSense
Questions to ask yourself
Locating the FormSense feature
How to use the FormSense feature
FAQs
Grant Access
Questions to ask yourself
Locating the Grant Access feature
How to Grant Access to users
FAQs
PowerClerk Program Launch
PowerClerk Responsive Admin View
PowerClerk User Group Sessions (UGS)
Learning Management System (LMS)

Dashboards

Create compelling charts and graphs that track program milestones and performance.


Questions to ask yourself before building a Dashboard:

What are the typical performance metrics that your program must report?


Does your program have examples of other graphs or charts that my organization has traditionally made in Excel?


What are the data field names for the fields I want to include in the Dashboard?

Locating the Dashboard feature

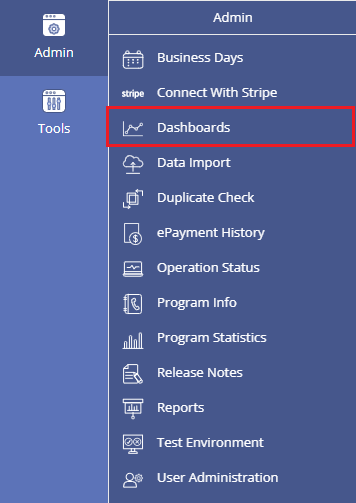
Anyone in a Role with the Edit Roles privilege can enable users to use Dashboards. Dashboard access is added by checking the “Edit Dashboards” checkbox when editing specific role permissions. Once enabled, Dashboards are located under the ADMIN menu and opened by clicking on Dashboards:
 

Figure 1: ADMIN >> Dashboards


How to create widgets in your Dashboard

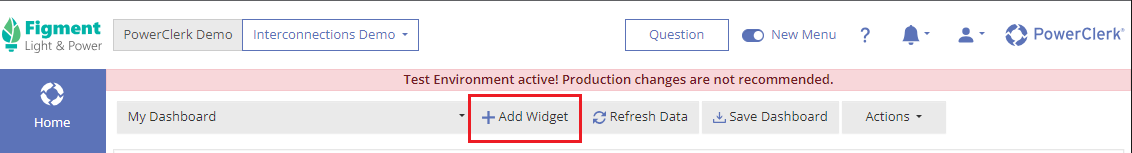
Each program is set to display a default widget in your Dashboard which displays the current project count by status. To create a new widget in your Dashboard, click on the +Add Widget button. The new widget tray will open on the right side of your browser window.
 

Figure 2: Creating a new widget in the Dashboard

 
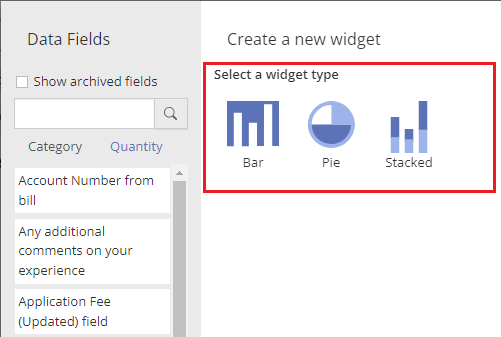
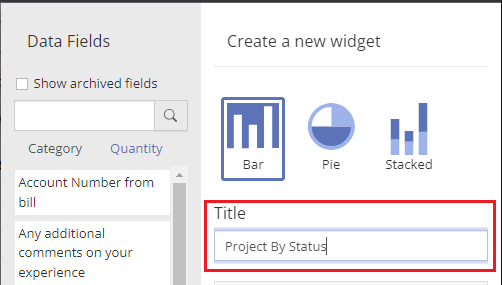
To start building your widget, first select which type of widget you’d like to build: (1) a bar chart, (2) a pie chart, or (3) a stacked bar chart.
 

Figure 3: Example widget types

 
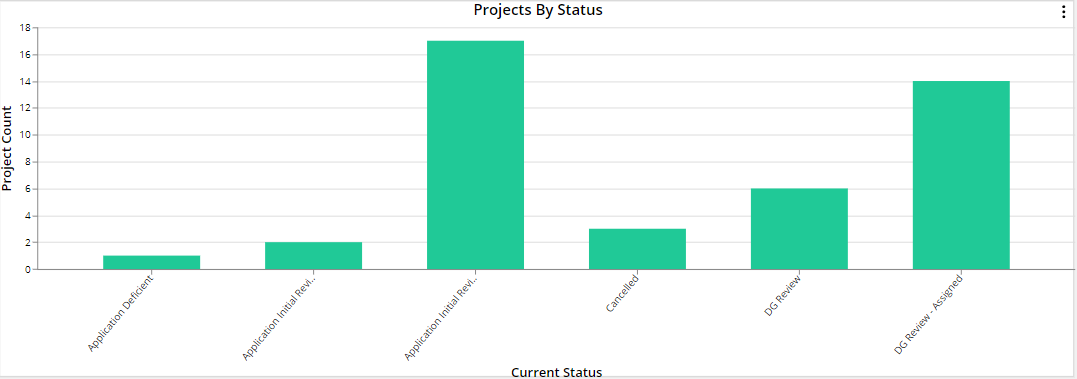
Please note, the design of your widget type will impact how useful your graph is for communicating the intended program performance metrics.  For example, the bar chart will be most effective in displaying the performance of the program, where you want to show the current number of projects in each status:
 

Figure 4: Sample bar chart displaying total projects in each status

 
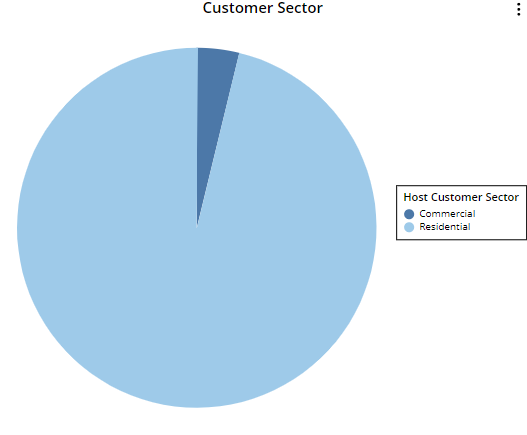
Alternatively, if you’re trying to report on the relative volumes of specific types of projects, then use a pie chart.  For example, this pie chart shows the breakdown of projects in a program by the customer segment (residential, commercial):
 

Figure 5: Sample pie chart displaying the percentage of projects that are owned by different customer sectors

 
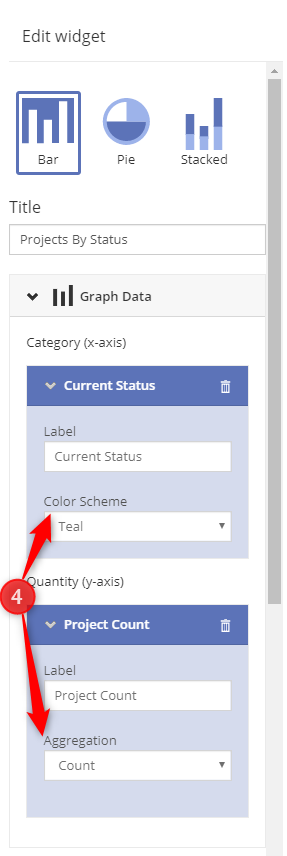
Once you have selected your widget type, you’ll be presented with options to name your widget, graph data and create data filters.  These options will allow you customize your widget to reflect the exact data you wish to present.   First, to name your widget, click in the text box and type your desired name (Figure 6 showing the example name “Projects By Status”):
 

Figure 6: Naming your Dashboard widget

 
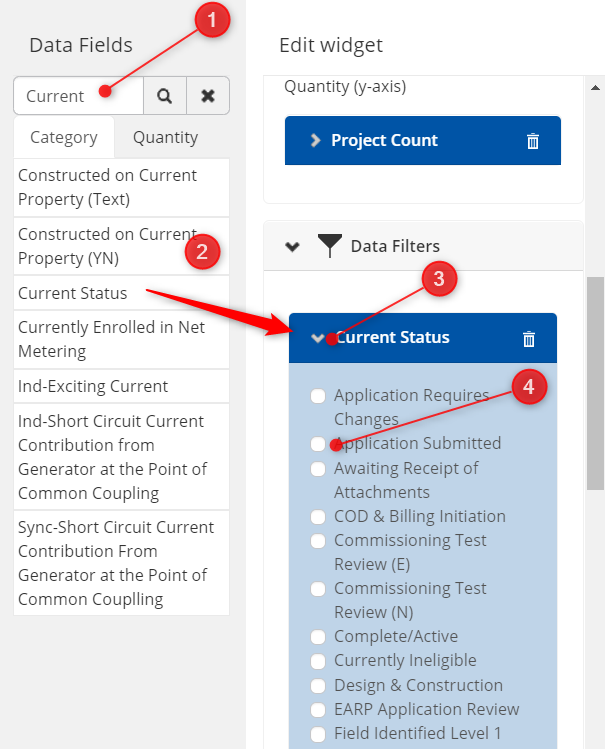
Once you’ve named the widget, you can then drag-and-drop data into the “Category (x-axis)” and “Quantity (y-axis)” fields.  This process begins by selecting either “Category” or “Quantity” and searching the data field name search box (1, below).  The widget feature will only allow you to drag eligible data fields into the appropriate box (2).  Eligible boxes are designated during drag-and-drop by turning green.
 

Figure 7: Inserting data into Category and Quantity fields

 
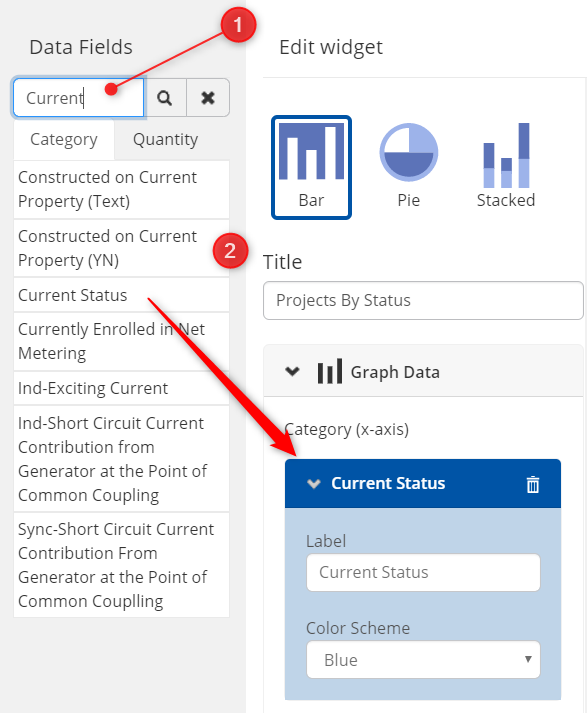
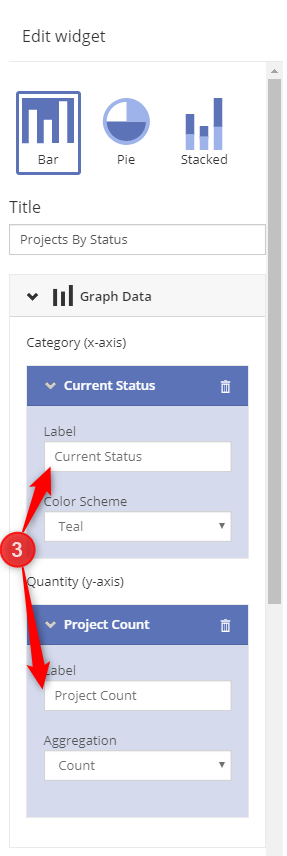
Last, you are able to modify the x and y axis labels and settings.  Specifically, the labels for the Category and Quantity (3) and the Category’s Color Scheme and Quantity’s aggregation (typically, sum or average) (4).
 

Figure 8: Editing Category and Quantity labels, color scheme and aggregation

 
Once you have selected the graph data, you can create data filters.  This will allow you to show only data fields that are relevant to the viewer of your Dashboard.  Again, the Dashboards feature will only allow you to select data fields that can be filtered by turning them green during drag-and-drop:
 

Figure 9: Creating data filters

 
Please note: The widget title and data labels will show up on the finished widget once your settings have been saved.   If you want to change the data label or widget title, you are able to edit this text in the future.
 
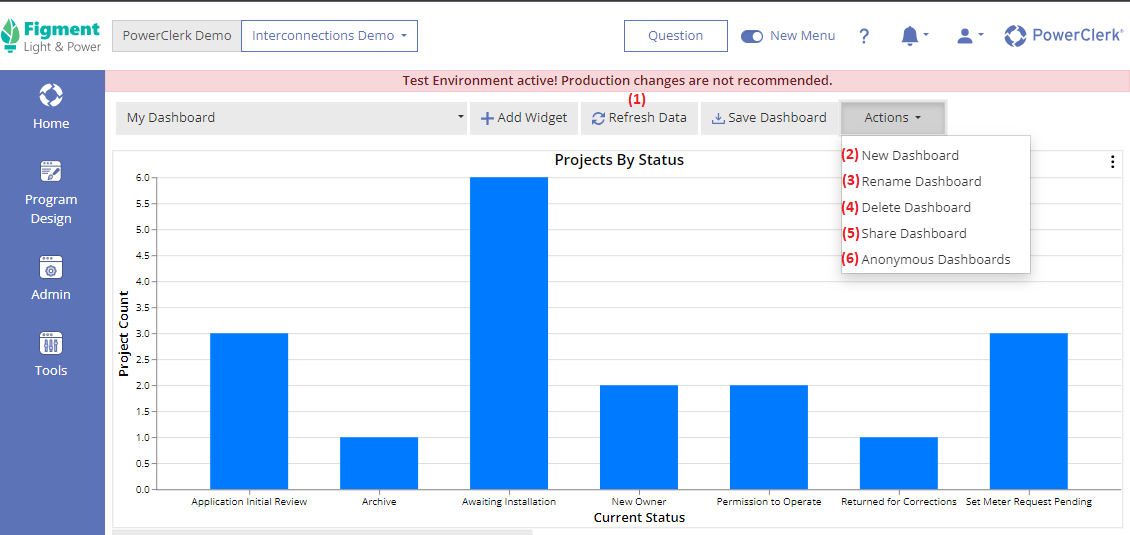
Once you are happy with your widget settings, save the widget by clicking “Save” at the bottom of the edit widget tray.  Also note: you will need to save changes to the entire Dashboard by clicking the “Save Dashboard” button at the top of your Dashboard.


Other Dashboard Actions: Refresh, New, Rename, Delete, Share

There are set of functions that allow you to manage your Dashboards. These actions are:
 

  1. Refresh – This action refreshes the data in your widgets, allowing you to update and publish your graphs with a single click.
  2. New – This will create a new Dashboard. Separate Dashboards will allow you to sort widgets when determining how you want to share graphs with other Roles.
  3. Rename – This will allow you to rename the Dashboard that you’re currently working on.
  4. Delete – This will delete the Dashboard that you’re currently working on. You will be prompted to confirm deletion.
  5. Share – This action allows you to share Dashboards with other Roles in your program.  See more below.


Figure 10: Dashboard Actions

 
When you decide to share your Dashboard, you are giving read-only access to other Roles in your program. This means that anyone in the Role can view (but not edit) your Dashboard. Shared Dashboards appear on the Dashboards drop down menu for all users who have been granted shared access.  Once you have selected Actions >> Share Dashboard, the following settings menu will appear.
 

Figure 11: Share Dashboard settings

 
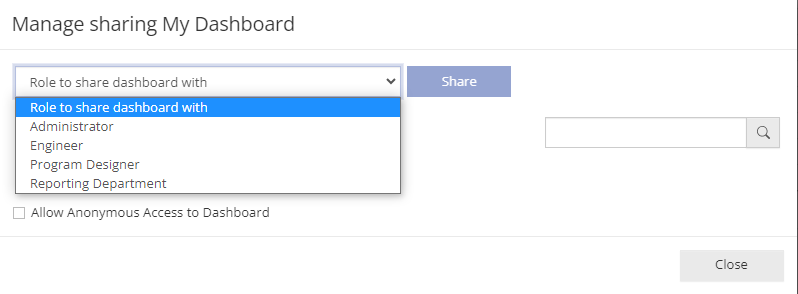
To share the Dashboard, select the Role in your program that you wish to share then click the blue “Share” button. Reminder, all of the widgets in the Dashboard will be visible to the users in this Role. This Role will then appear in the shared roles list.  To remove a Role from access, select the Role and click “Remove”.


How to edit or delete existing Dashboard widgets

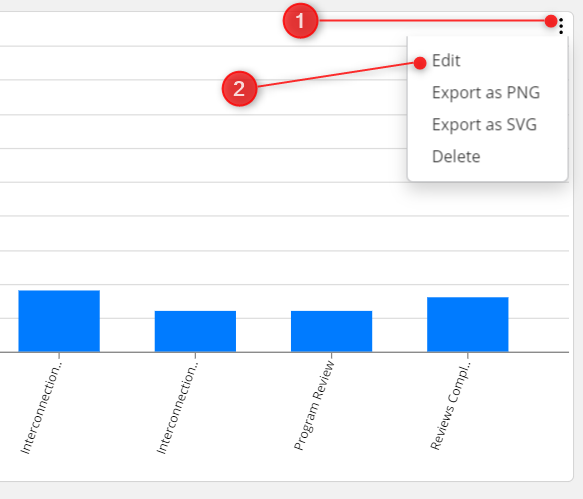
If you have a widget that is already created or you wish to edit the default program widget, you can access the same set of controls by selecting the icon in the widget’s upper right corner and clicking “Edit”:
 

Figure 12: Editing existing widgets

 
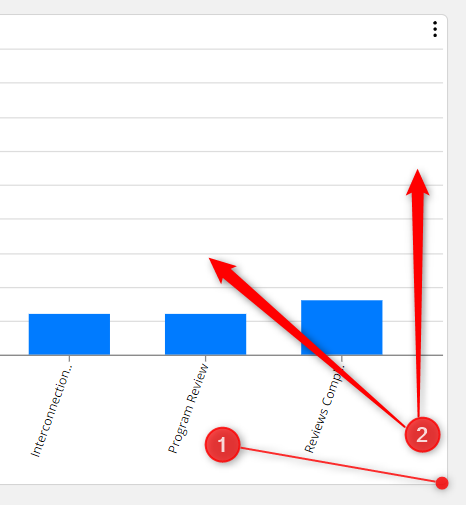
Selecting “Edit” will open the same tray used for creating new widgets, except it will have the Category, Quantity and Filter fields specified.   You can resize your widget in your Dashboard. This will allow you to configure the layout for the easiest viewing of your widgets.  To move the widget, hover over the widget, click and move.   To resize the widget, click and grab and edge of the widget and drag to the desired shape:
 

Figure 13: Resizing widgets

 
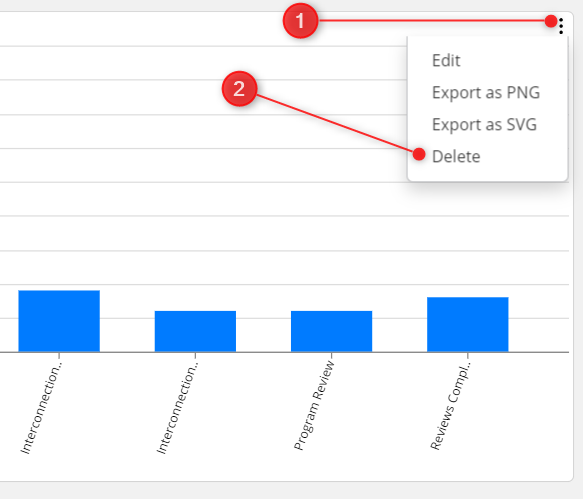
To delete your widget, select the icon in the upper right and click “Delete”.  You will NOT be prompted to confirm the deletion, so be careful when you decide to delete a widget.
 

Figure 14: Deleting widgets


How to publish widgets in your Dashboard

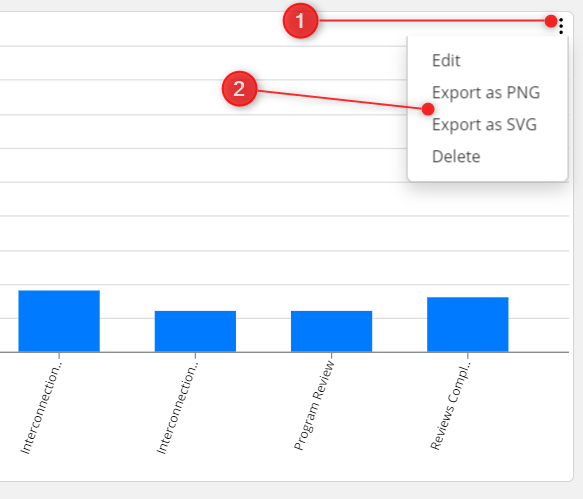
Currently, you can export widget images for use in other applications like email or program reports.  To publish a widget from your Dashboard, select the icon in the upper right and select either “Export as PNG” or “Export as SVG”.  The selected file type will download to your computer.
 

Figure 15: Exporting a PNG or SVG image


Embedding Dashboards on a program’s Front Page

Please note: please contact us by submitting a support request via Ticket System to enable the option for embedding Dashboards.
 
When clicking within the Dashboards section on button Actions the option “Anonymous Dashboards” allows you to retrieve the embed code snippets necessary to display your Dashboard on external pages or your program’s Front Page:
 

Anonymous Dashboards

Figure 16: Anonymous Dashboards

 
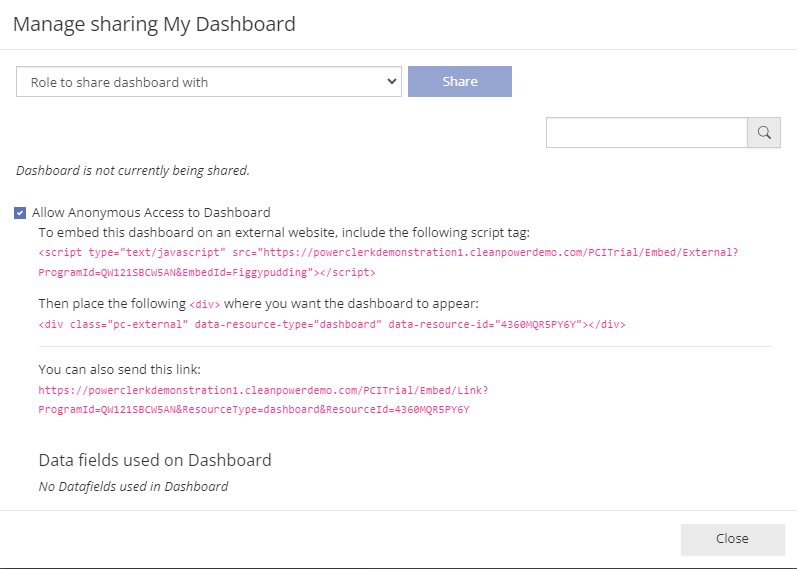
For example to embed your Dashboard on your programs front page you select and copy the <div>…</div> portion of these snippets in the Front Page editor’s source code-view accordingly:
 

Anonymous Dashboards

Figure 17: Embedding Anonymous Dashboards

 
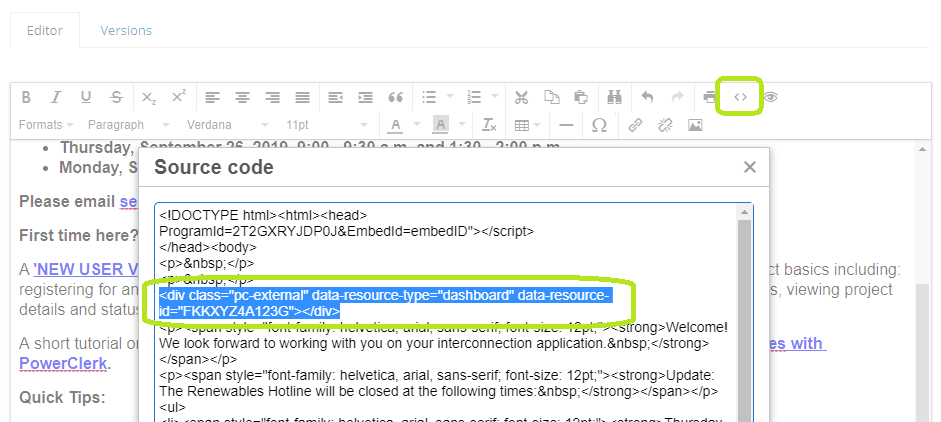
Please note: If you aim to embed the Dashboard in an external website (e.g. not solely on your PowerClerk program’s Front Page) then you will want to also copy the <script>…</script>-tags into the header setcion of your external website.
 
See below for example a Dashboard embedded directly in this page from the PowerClerk Ticket System:

Video Guides

Dashboards

This video guide will show you how to setup, edit, resize, and position Dashboards and how to export a Dashboard as an image for your reporting.


A full list of all Video Guides can also be found here.

FAQs

Q: Are Dashboards available to me in my program?
A: Yes, Dashboards were designed for any user to get access to reporting tools that increase the efficiency and visibility of their program - just like Reports!  To get Dashboard permissions added, please submit an access request to the PowerClerk team or ask an administrator at your organization that has Edit Roles permission.
Q: What are some common uses of Dashboards?
A: Dashboards can be used to visually display lots of different program data sets.  We built the Dashboard feature to allow you to create visual references in your program reporting that easily convey program performance metrics.  Some examples of this might be:
  • Reporting on the efficiency of the workflow - how long do projects typically spend in each task and where are the bottlenecks?
  • Reporting on workload - how many projects do I currently have in each status and where should I direct my team?
  • Reporting against program goals - how many projects or how many MW is my program processing by day/month/year?

Have additional questions? Contact us to nominate your FAQ and help others find answers to your own questions concerning this feature.

Create A Support Ticket

Not finding your answer here?  Submit a question to our support team at the PowerClerk Ticket System and leverage the PowerClerk team’s expertise.