WattPlan Support Center
WattPlan Reporting
WattPlan provides two different reporting options for detailed information on your WattPlan Instance(s): Google Looker Studio and PowerClerk Reporting.
Google Looker Studio
The Google Looker Studio (GLS) report features anonymized data from users of your WattPlan site. It includes aggregated session numbers, user drop-off rates, site visit durations, device usage statistics, clicked links, and more. Access to this report can be granted in two ways:
- The WattPlan team can set up GLS to automatically send you a PDF version of the report each month. Please Note: This option is the simplest but does not provide access to interactive report controls (e.g., date range).
- The WattPlan team can set you up to log in to GLS and access the report yourself as a Viewer. For this option, Google requires that you register your email with them first. You can follow the below instructions to use your existing account with Google:
- Go to the Google Account Sign In page.
- Click Create account.
- Enter your name.
- Click Use my current email address instead.
- Enter your current email address.
- Click Next.
- Verify your email address with the code sent to your existing email.
- Click verify.
Once setup, the WattPlan team will be able to add your email address so you can navigate to the Google Looker Studio report as a Viewer.
Google Looker Studio Dashboard FAQ
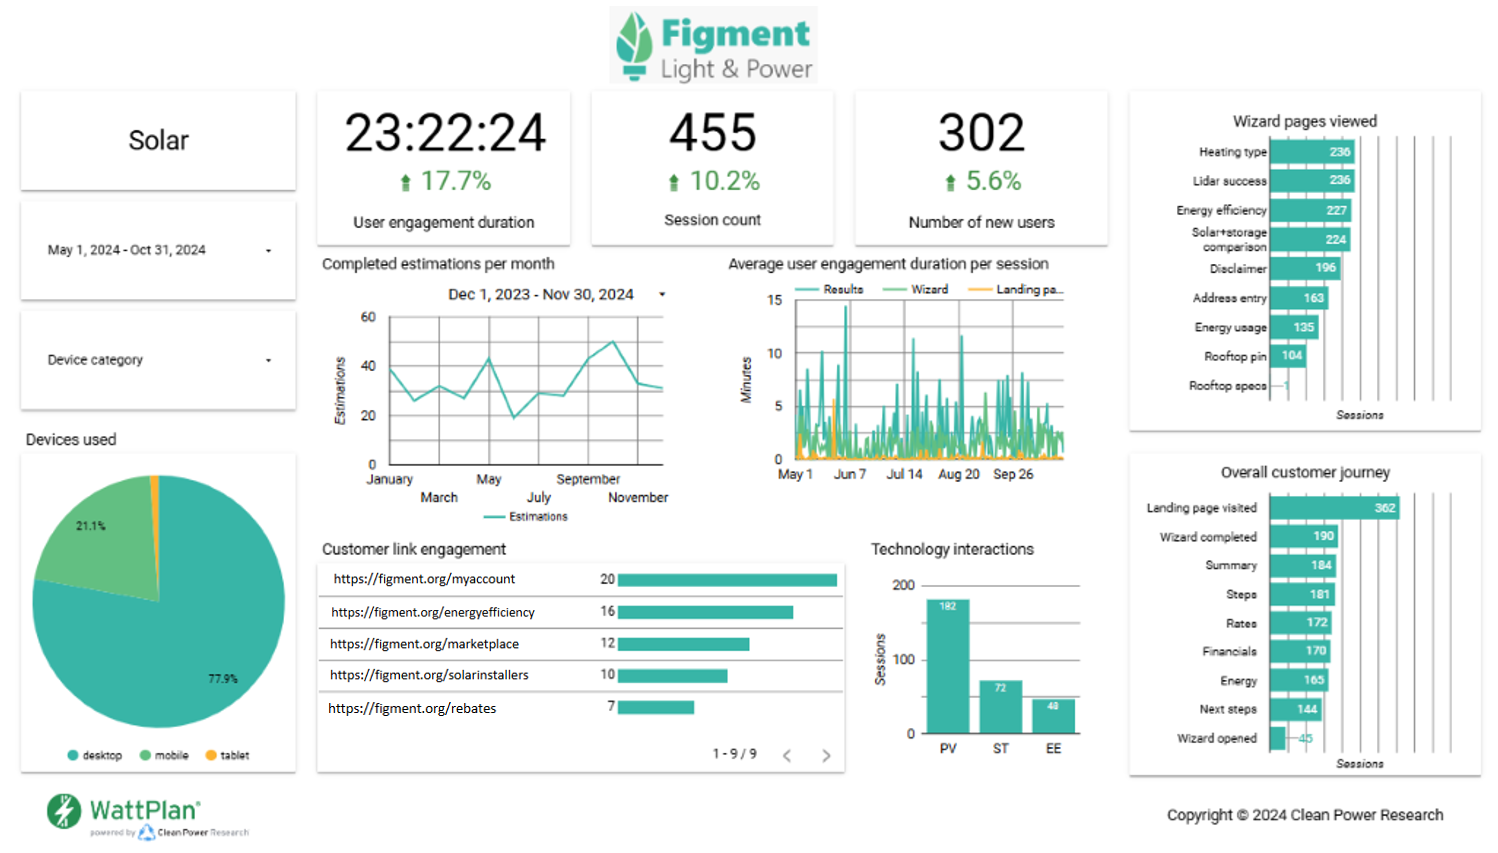
The Google Looker Studio Dashboard report captures several data points to help analyze your WattPlan site traffic and usage metrics. Below is a detailed description of each element within your dashboard.

- Site type: This displays the specific WattPlan site (Solar, EV, Rate Comparison). This is useful if your report contains more than one page.
- Date range: This module allows Viewers to select a date range in which they can view data.
- Device category: Allows Viewers to filter through each device type and view relevant data per device.
- Devices used: A pie chart displaying the percentage of users per device.
- User engagement duration: Measured in hours:minutes:seconds. The amount of time users are actively engaging with the site by clicking, scrolling, or typing.
- Session count: The total number of sessions across all users.
- Number of new users: A count of all new users to WattPlan that made at least one estimation during the reporting period.
- Completed estimations per month: A line graph displaying the number of completed estimations per month over the course of a year.
- Average user engagement duration per session: A line graph displaying the average amount of time in minutes that users are actively engaging on the landing page, wizard steps and results page.
- Wizard pages viewed: A count of how many users made it to each step of the wizard. Note: In authenticated mode, users will skip the address entry and energy usage steps resulting in lower page views.
- Overall customer journey: A count of how many users made it onto the landing page, through the wizard and through each section of the results page.
- Customer link engagement: A count of users clicking on external links within WattPlan. Use this metric to gauge what links are most popular.
- Technology interactions: A bar graph showing how many users are interacting with the technology specific wizard pages and changing the default selection. Examples includes the Energy Efficiency (EE) step or the Battery Storage (ST) step.
PowerClerk Reporting
The WattPlan Reports PowerClerk program provides access to customer-level data for each WattPlan session on your site.
This includes users’ inputs and selections, and details of the estimation results are shown. For each WattPlan user session and unique estimations, a new record is generated within the PowerClerk program. An initial report has been created within the program that has comprehensive coverage of all WattPlan reporting data for all user sessions on your site. You also have the option to create additional reports with a narrower focus by including only specific data fields, or by applying filters to report fields to refine the scope of interest e.g., estimations within a certain date range, estimations including a specific technology, etc. Running a PowerClerk report generates a .csv file of the results that can be downloaded for review and analysis.
The WattPlan team will add you as user to your Utility’s Reports Program and you will receive an automated email from PowerClerk confirming your access and asking you to set your new account’s password.
PowerClerk Reporting FAQ
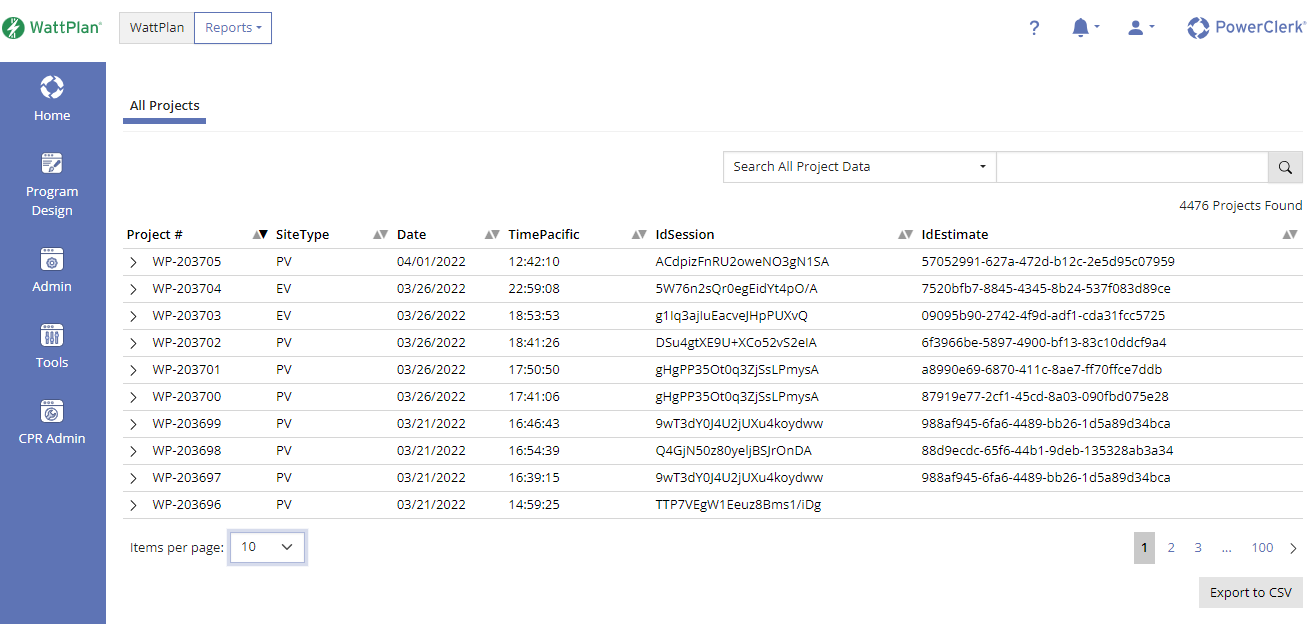
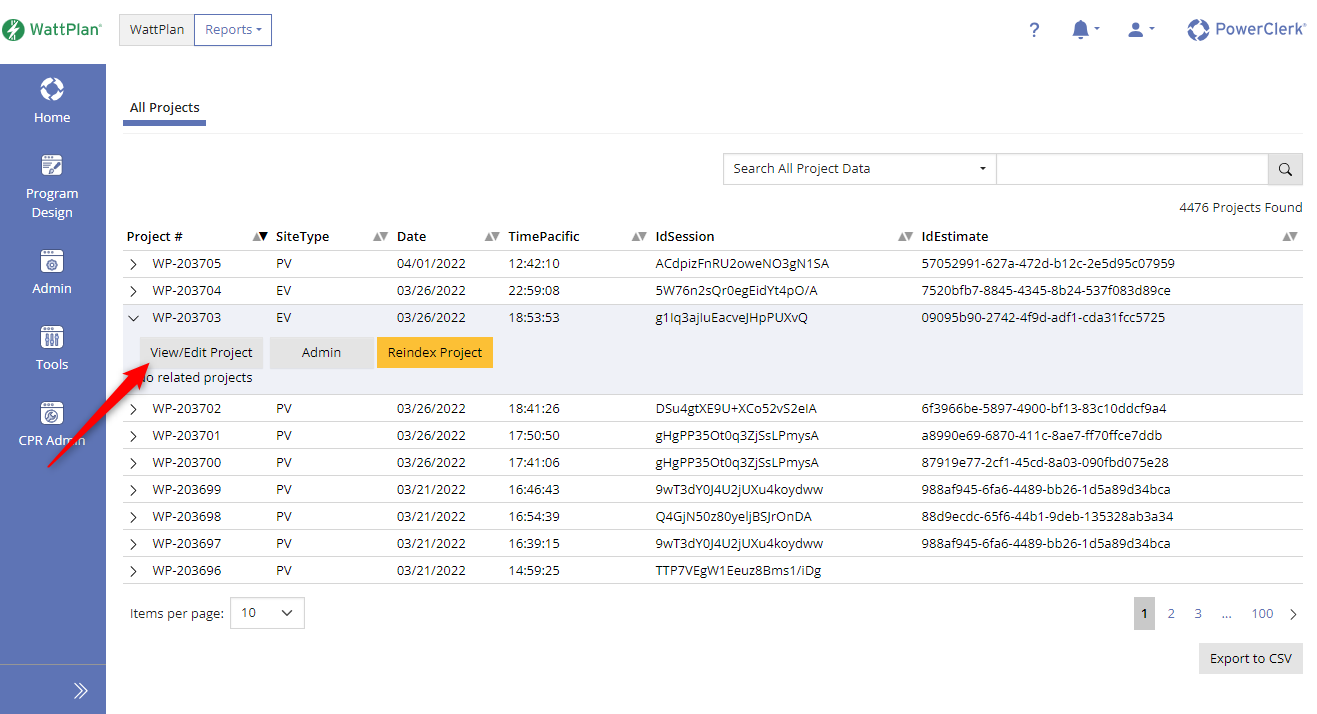
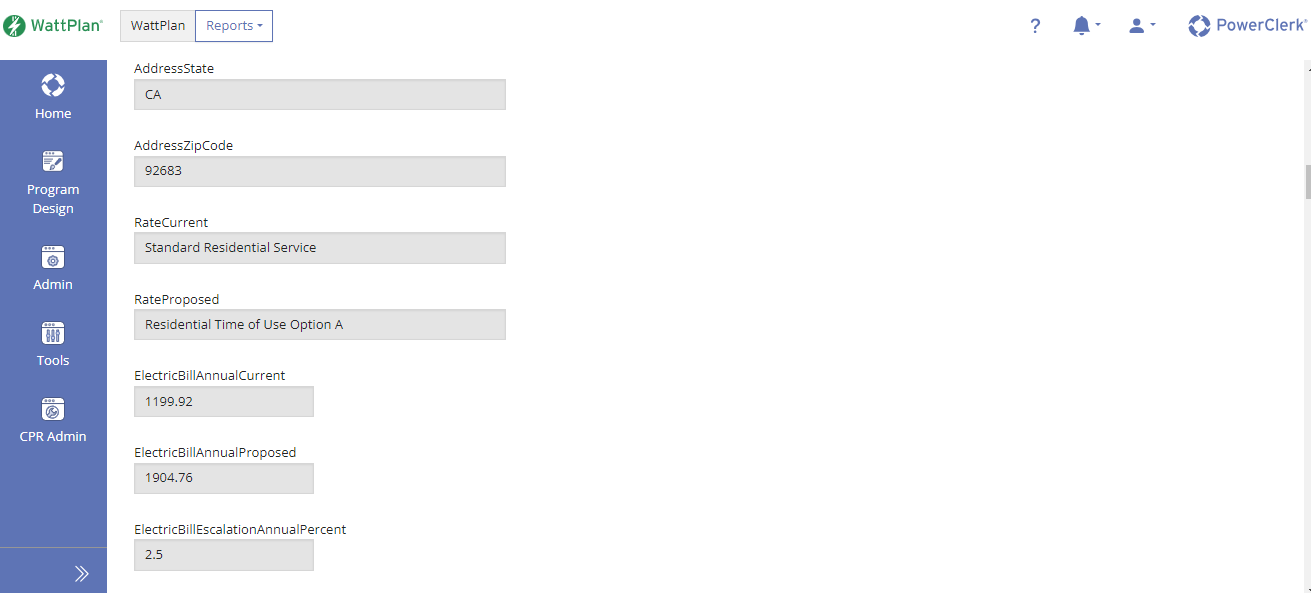
Once logged in to your utility’s PowerClerk Reports program, you can view individual user inputs by selecting the desired project on the Home page and clicking on the View/Edit project button.

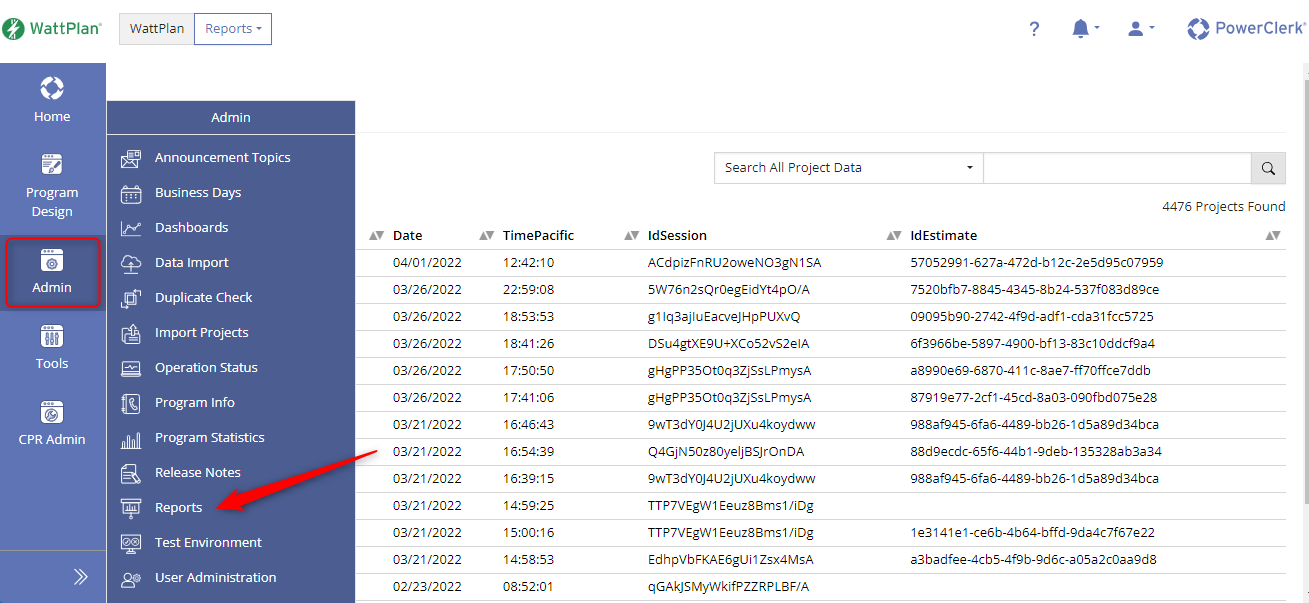
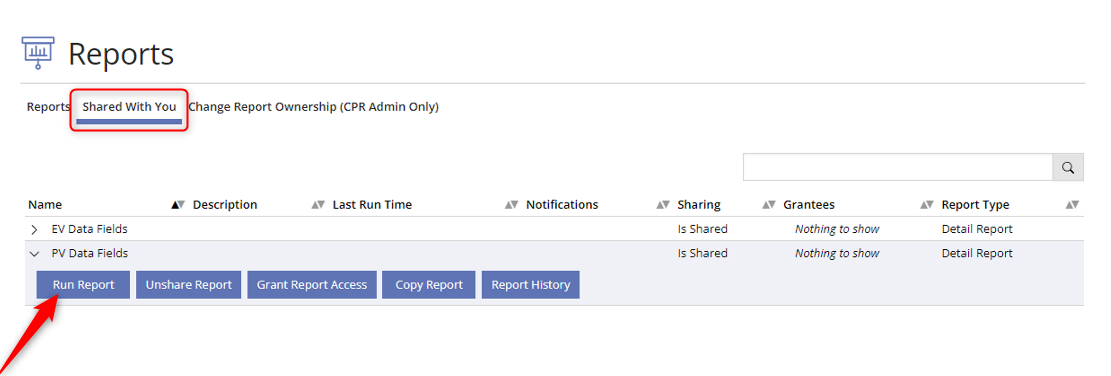
- Run a pre-made report by going to the Shared With You tab and running the appropriate report dependent on your site type (Figure 6)
- Create a report based on the data fields you wish to report on by going to the Reports tab and clicking New Detail Report (Figure 7)
Further detail on the reporting functionality made available through PowerClerk can be found on the Reports feature page of the PowerClerk Support Center.

Have additional questions? Contact us at support@wattplan.com and leverage the WattPlan team’s expertise.